Recorded data from oilfield service operations needs to be displayed in a meaningful manner in order to be able to best utilize the data for job evaluation and for making decisions during the job. Effective data recording, real-time presentation, and comprehensive job reporting are essential components of modern oilfield data acquisition systems, enabling operators to monitor operations, make informed decisions, document performance, and satisfy contractual reporting requirements.
For analysis of oilfield service job data it is necessary to record it. This is usually done on a computer hard disk, flash memory, or cloud storage. Creation of job reports is sometimes required by customers as a matter of policy in order to archive the service operation and job results, provide legal documentation, support invoicing, and enable post-job analysis.
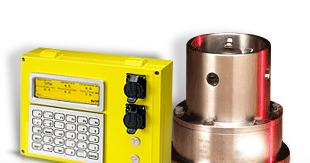
The Rapidlogger system and its included RapidVu software perform all of these tasks automatically. This system acquires the sensor data during service jobs, records the data, displays realtime graphs and allows the operator to prepare an automatic job report.
Modern oilfield data acquisition systems employ sophisticated recording architectures designed to capture, store, and protect critical operational data under harsh field conditions. Understanding the recording system architecture is essential for reliable data capture and retrieval.
Multi-Tier Recording Architecture:
The Rapidlogger system employs a redundant multi-tier recording strategy to ensure data integrity:
• Primary Recording (Onboard SD Card): The Rapidlogger unit continuously records all sensor data to an industrial-grade SD memory card (1GB to 16GB capacity). Recording begins automatically upon power-up—no operator intervention required. The SD card uses wear-leveling algorithms and error correction codes (ECC) to maximize reliability and lifespan despite frequent write operations. Data is recorded in plain text format with timestamp, making it human-readable and compatible with standard text editors.
• Secondary Recording (PC via RapidVu): When connected to a PC running RapidVu software via Ethernet or WiFi, data is simultaneously recorded to the computer's hard drive in real-time. This provides immediate backup and enables larger storage capacity. RapidVu creates both native format files (.rlg) and Comma-Separated Value (.csv) files for direct import into Excel or other analysis tools.
• Cloud Recording (Rapidlogger Cloud Link): For remote monitoring applications, data can be transmitted to cloud storage in real-time via cellular modem, satellite link, or internet connection. Cloud recording provides off-site backup, remote access for supervisors and customers, and long-term archival storage.
• Tertiary Backup (Manual Download): After job completion, data can be downloaded from the SD card via Ethernet using the Rapidlogger Hardware menu in RapidVu, providing an additional recovery path if primary storage fails.
Recording Capacity and Performance:
Recording capacity depends on sampling rate, number of channels, and storage media size:
• Typical Configuration: Recording 8 parameters at 1-second intervals to a 1GB SD card allows continuous recording for more than 2 months (60+ days). Calculation: 8 channels × 10 bytes/sample × 1 sample/second × 86,400 seconds/day × 60 days ≈ 415 MB.
• High-Speed Applications: Recording 16 parameters at 10 samples/second (100ms interval) to a 16GB SD card provides approximately 115 days of storage. High-speed recording is used for transient analysis, vibration monitoring, or rapid pressure fluctuations during fracturing.
• Extended Monitoring: For wellhead monitoring or long-duration applications, slow sampling rates (1 sample per minute) with 8 channels can record for years on a single 16GB card.
• Circular Buffering: Optional circular buffer mode overwrites oldest data when storage is full, enabling continuous long-term monitoring without manual card erasure. Useful for permanent installations where only recent data is needed.
Data File Formats and Structure:
The Rapidlogger system uses open, documented file formats to ensure data accessibility:
• Native Format (.rlg): Plain text files with header containing job information (date, time, operating mode, sensor configuration, units, scaling factors) followed by timestamped data records. Each line contains: timestamp, parameter 1, parameter 2, ... parameter N. Text format ensures data is never locked in proprietary binary formats and can be recovered even if original software is unavailable.
• CSV Format (.csv): RapidVu automatically generates CSV files compatible with Microsoft Excel, MATLAB, Python, and other analysis tools. CSV files include header row with parameter names and units, followed by data rows with timestamp and all parameters. The CSV "List Separator" character (comma) must be configured correctly in Windows regional settings for proper Excel import.
• Header Information: File headers document complete job metadata including: Rapidlogger serial number, firmware version, sensor calibration data, job start time, operating mode (cementing, fracturing, coiled tubing, etc.), company name, well name, and operator comments entered during the job.
• Timestamp Format: All data records include absolute timestamps (date and time) from the battery-backed real-time clock, ensuring accurate correlation of events even across multiple jobs or system power cycles. Time synchronization can be performed from the RapidVu software or manually from the front panel.
Data Integrity and Protection:
Oilfield operating conditions demand robust data protection mechanisms:
• Write Verification: After writing data blocks to the SD card, the Rapidlogger reads back and verifies the written data matches what was intended. Verification failures trigger error indicators on the LCD screen (checkmark icon becomes 'X') and generate alarm logs.
• Power-Fail Protection: Buffered write architecture ensures that power interruptions do not corrupt data files. Current data block is finalized and file directory is updated before power loss. On next power-up, the system automatically continues recording to a new file.
• SD Card Health Monitoring: The system monitors SD card status including: card presence detection, free space available, write errors, and card speed. Status indicators on the LCD display alert operators to potential card problems before data loss occurs.
• Automatic Rollover: When the SD card approaches capacity (configurable threshold, typically 90% full), the system generates warnings and can optionally halt recording or overwrite oldest files to prevent data corruption from full storage.
• Industrial-Grade Media: Rapidlogger systems use industrial-temperature-rated SD cards (-40°C to +85°C) with enhanced durability compared to consumer cards. Cards are rated for vibration, shock, and extended write cycles typical of oilfield applications.
Real-time data visualization is critical for monitoring job progress, detecting anomalies, and making operational decisions during time-sensitive operations such as fracturing, cementing, and wireline services.
Rapidlogger LCD Display Presentation:
The Rapidlogger front panel LCD provides immediate local data display without requiring a connected PC:
• Multi-Parameter Display: Displays up to 6 parameters simultaneously with parameter name, current value, and engineering units. Typical display shows pressure, density, flow rate, total volume, depth, and load—all at once on a single screen.
• Sunlight-Readable Display: High-contrast LCD visible in direct sunlight for outdoor oilfield use. Backlight automatically activates in low light for nighttime operations.
• Status Indicators: Three icons on the display show system status: (1) Data acquisition active (flashes each time sensors are read), (2) Network transmission active (flashes when data is sent to PC), (3) Recording status (checkmark = successful recording, 'X' = recording failure or SD card missing).
• Configurable Display: Operators can select which parameters to display and configure display format (6-parameter or 4-parameter layout) based on application requirements and personal preference.
• Keypad Access: Front panel function keys (F1-F6) provide access to menus for zeroing readings, calibrating sensors, adjusting settings, entering job comments, and viewing diagnostic information—all without requiring a PC connection.
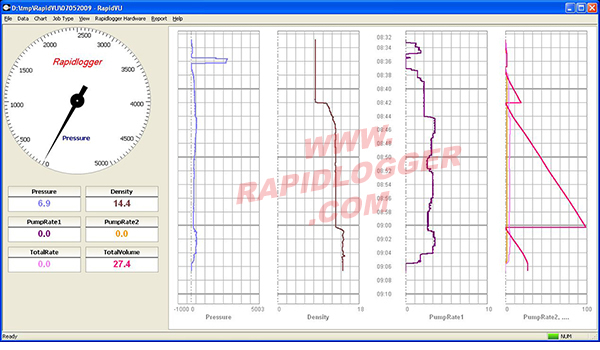
RapidVu Software Real-Time Visualization:
The RapidVu PC software provides comprehensive real-time data presentation with advanced visualization capabilities:
• Multi-Plot Display: Simultaneous display of multiple parameters on individual plots or combined on shared time or depth axes. Operators can arrange plots vertically or horizontally, resize plot areas, and customize color schemes for optimal visibility.
• Time-Based Plotting: X-axis represents elapsed time or absolute time (clock time). Used for most pumping operations (cementing, fracturing, acidizing) where chronological sequence is important. Time-based plots show rate of change and temporal relationships between parameters.
• Depth-Based Plotting: X-axis represents measured depth or true vertical depth. Essential for wireline, slickline, and coiled tubing operations where data must be correlated to wellbore position. Depth sensors (encoders) trigger data recording at fixed depth intervals rather than fixed time intervals, ensuring uniform spatial resolution regardless of cable speed.
• Cross-Plot Capability: Plot any parameter against any other parameter (e.g., density vs. flow rate, pressure vs. total volume). Cross-plots reveal relationships and correlations not visible in time-series plots and aid in quality control and process optimization.
• Scalable Axes: Auto-scaling adjusts axis ranges to fit data dynamically, or manual scaling fixes axes for consistent display. Logarithmic scales available for wide dynamic range parameters. Independent left and right Y-axes allow plotting parameters with different units and scales on the same plot.
• Data Cursors: Interactive cursors display exact parameter values at any point on the plot. Dual cursors measure time intervals, depth intervals, and parameter differences between two points. Cursor readout shows all parameter values at the selected time/depth.
Alarms and Event Detection:
Real-time monitoring systems can automatically detect and alert operators to critical conditions:
• High/Low Alarms: Configurable alarm limits for any parameter trigger visual and audible alerts when values exceed safe or specified ranges. For example, cement density alarms at ±0.2 lb/gal from target density alert the operator to batch quality issues.
• Rate-of-Change Alarms: Detect rapid parameter changes indicating abnormal conditions (e.g., sudden pressure drop indicating line rupture, rapid density change indicating batch change or contamination).
• Alarm Logging: All alarm events are timestamped and logged to job files for post-job review. Alarm logs document when problems occurred and how operators responded.
• Visual Indicators: Alarm conditions highlighted on plots with color changes, flashing indicators, or shaded regions. Parameter values exceeding limits displayed in red or with warning symbols.
• Integration with Control Systems: Digital outputs on the Rapidlogger can trigger external alarms, shutdown systems, or pump control systems based on sensor data, providing automated safety interlocks.
Customizable Dashboards and Layouts:
RapidVu allows operators to create custom screen layouts tailored to specific job types:
• Operation-Specific Layouts: Pre-configured screens for cementing (pressure, density, flow, volume), fracturing (treating pressure, slurry rate, proppant concentration, total proppant), wireline (depth, cable tension, speed, gamma ray), and coiled tubing (depth, weight on tubing, pump pressure, N2 rate).
• Dial Displays: Analog-style gauge displays for parameters where instantaneous value is more important than historical trend. Gauge displays provide at-a-glance status and are easier to interpret from a distance than numeric displays.
• Numeric Readouts: Large numeric displays for critical parameters. Font size, color, and decimal precision are configurable. Numeric displays can show current value, maximum value, minimum value, or average value over a specified time window.
• Multiple Monitor Support: RapidVu can span displays across multiple monitors, allowing large plot areas, simultaneous viewing of multiple job aspects, or dedicated displays for different audiences (operator screen, client screen, management screen).
• Saved Configurations: Screen layouts, plot configurations, alarm settings, and color schemes can be saved as configuration files and quickly loaded for different job types or operator preferences. Configuration files can be shared across multiple RapidVu installations for consistent presentation across a fleet.
Comprehensive job reports document operational performance, satisfy contractual requirements, support invoicing, and provide archival records for regulatory compliance and future reference.
Automated Report Generation in RapidVu:
RapidVu includes powerful report generation tools that automate the creation of professional job reports:
• Template-Based Reports: Customizable report templates define the structure and content of job reports. Templates include company logos, standard headers/footers, legal disclaimers, and pre-formatted sections for job data, plots, comments, and observations.
• Automatic Plot Inclusion: Plots displayed on screen during the job are automatically captured and inserted into reports at appropriate locations. Plot appearance (colors, line styles, labels, legends) in the report matches the screen display, ensuring consistency between real-time monitoring and final documentation.
• Data Tables: Reports can include tabular summaries of job data: maximum/minimum values, averages, totals, time stamps of critical events, alarm summaries, and statistical analysis. Tables are automatically populated from recorded data without manual entry.
• Job Comments Integration: Comments and observations entered by the operator during the job (via the Rapidlogger front panel or RapidVu software) are automatically incorporated into the report with timestamps. Comments document operational decisions, equipment changes, observed conditions, and other contextual information not captured by sensors.
• Multi-Format Export: Reports can be generated in multiple formats: PDF (for electronic distribution and archival), Microsoft Word (.docx) for editing and customization, and HTML for web viewing. PDF reports include embedded fonts and graphics ensuring consistent appearance across all viewing platforms.
• Digital Signatures: Reports can include digital signatures from operators, supervisors, and client representatives, providing authentication and non-repudiation for contractual and legal purposes.
Report Content and Sections:
Comprehensive job reports typically include the following sections:
• Cover Page: Company name and logo, client name, well identification (lease, well number, location), job type (cementing, fracturing, wireline, etc.), job date and time, equipment identification (pump unit number, Rapidlogger serial number), operator names, client representative name.
• Executive Summary: Brief overview of job objectives, results achieved, total volumes pumped, maximum pressures, operational time, and any significant events or deviations from plan.
• Equipment and Sensor Configuration: List of all sensors used with model numbers, serial numbers, calibration dates, and measurement ranges. Documentation of data acquisition system configuration including sampling rate, recording mode, and alarm settings. This section provides traceability and supports quality assurance requirements.
• Time-Based Plots: Complete time-history plots showing all critical parameters throughout the job. Multi-parameter plots with shared time axis allow correlation of events across different measurements. Plot sections can be segmented by job phase (mixing, pumping, displacement, shut-in) with annotations marking phase transitions.
• Depth-Based Plots: For depth-oriented operations (wireline, slickline, coiled tubing), plots showing all parameters versus depth. Depth plots may include multiple runs (e.g., wireline descent and ascent) overlaid for comparison. Annotations mark formation tops, casing collars, perforations, and other depth-referenced features.
• Summary Tables: Tabular data including total volume pumped, average rate, maximum pressure, pressure decline rate, job start/end times, total job duration, stage volumes and pressures (for multi-stage completions), and any other contractually required summary data.
• Alarm and Event Log: Chronological list of all alarms and events during the job with timestamps, parameter values, and operator responses. Event log provides accountability and documents how anomalous conditions were handled.
• Operator Comments: Free-text comments entered during the job providing context, explanations, and observations. Comments might document equipment changes, operational adjustments, observed leaks, weather conditions, or communications with client representatives.
• Certification and Signatures: Statement certifying data accuracy and system calibration status, operator signature confirming report accuracy, supervisor approval signature, client representative acceptance signature (if required by contract).
• Appendices: Supporting documents such as sensor calibration certificates, equipment specifications, job procedures, safety documentation, and regulatory compliance records.
Customization for Different Job Types:
Report templates are customized for different oilfield services to highlight relevant information:
• Cementing Reports: Emphasize density control (target density, actual density range, standard deviation), volume accuracy (planned vs. actual), displacement efficiency, and returns analysis. Include plots of pressure, density, and flow rate vs. time or volume.
• Fracturing Reports: Focus on treating pressure, slurry rate, proppant concentration, total proppant placed, instantaneous shut-in pressure (ISIP), and pressure decline analysis. Include stage-by-stage summaries for multi-stage completions and proppant schedule adherence tables.
• Wireline/Slickline Reports: Depth correlation, cable tension vs. depth, speed profiles, time at depth, stuck pipe incidents, and tool performance data. Depth-based plots with annotations for formation features and operational events.
• Coiled Tubing Reports: Depth in/out, tubing weight, wellhead pressure, N2 rate, circulation rate, and pump pressure. Depth-based plots showing weight and pressure profiles during run-in-hole and pull-out-of-hole operations.
• Drilling Reports: Hole depth, rate of penetration (ROP), weight on bit (WOB), rotary speed (RPM), torque, mud flow rate, pit volumes, and mud properties. Include drilling efficiency analysis and cost per foot calculations if required.
Rapid Report Delivery:
Modern workflows demand fast report turnaround:
• Real-Time Report Preview: Reports can be generated and previewed in RapidVu while the job is still in progress, allowing operators to verify report accuracy and completeness before job completion.
• Automatic Email Distribution: RapidVu can automatically email completed reports to distribution lists immediately upon job completion. Email includes PDF attachment and customizable message body with job summary information.
• Cloud Upload: Reports can be automatically uploaded to cloud storage (Dropbox, Google Drive, SharePoint, or company-specific servers) for immediate access by back-office personnel, management, and clients.
• Mobile Device Access: PDF reports are optimized for viewing on tablets and smartphones, enabling field supervisors and clients to review job reports remotely without requiring desktop computers.
• Same-Day Delivery: With automated report generation and distribution, clients can receive final job reports within hours of job completion rather than days or weeks, improving customer satisfaction and enabling faster operational decisions.
Beyond real-time monitoring and reporting, recorded data supports detailed post-job analysis, quality improvement, and operational optimization.
Playback and Analysis in RapidVu:
RapidVu provides comprehensive playback capabilities for detailed post-job analysis:
• Variable-Speed Playback: Replay recorded jobs at slower than real-time for detailed examination of rapid events, or faster than real-time for quick overview of long jobs. Pause, rewind, and frame-by-frame stepping allow precise analysis of specific events.
• Zoom and Pan: Magnify plot regions to examine fine details. Zoom into millisecond-level resolution for high-speed data or zoom out to view entire multi-hour jobs. Pan through time/depth while maintaining zoom level.
• Measurement Tools: Measure time intervals, depth intervals, pressure differentials, flow rate changes, and other parameters between any two points. Calculate slopes (rates of change), areas under curves (total volumes), and other derived quantities.
• Overlay and Comparison: Overlay multiple jobs on the same plot to compare performance across different wells, different stages of the same well, or before/after process changes. Overlay comparison reveals trends, best practices, and anomalies.
• Data Export for Advanced Analysis: Export data to CSV format for import into Excel, MATLAB, Python, or specialized analysis software. Exported data retains full resolution and includes all recorded parameters and timestamps.
Integration with Third-Party Software:
Rapidlogger data can be integrated with industry-standard software for specialized analysis:
• Microsoft Excel: CSV files directly import into Excel for custom plotting, statistical analysis, pivot tables, and integration with other data sources (drilling logs, production data, cost tracking).
• Spotfire / Power BI: Business intelligence platforms can ingest Rapidlogger data for fleet-wide analysis, performance benchmarking, and executive dashboards.
• Fracture Modeling Software: Fracturing pressure and rate data can be exported to fracture modeling programs (FracCADE, MFrac, StimPlan) for net pressure analysis, fracture geometry estimation, and treatment optimization.
• Well Engineering Software: Integration with well planning and engineering software enables comparison of actual vs. planned operations, updating models based on field data, and improving future well designs.
Quality Control and Performance Metrics:
Recorded data enables quantitative quality control and performance measurement:
• Specification Compliance: Automated checking of whether operational parameters remained within specified tolerances (e.g., cement density ±0.2 lb/gal, fracture treating pressure within safe operating limits).
• Statistical Process Control: Track key performance indicators (KPIs) across multiple jobs to identify trends, detect process drift, and quantify variability. Control charts (X-bar, R-charts, Cp/Cpk) applied to cement density, flow rates, or other critical parameters.
• Benchmarking: Compare job performance against historical averages, best performers, or industry standards. Benchmarking identifies high-performing crews and best practices for replication.
• Root Cause Analysis: Detailed time-series data supports investigation of equipment failures, quality incidents, safety events, and cost overruns. Correlation analysis reveals cause-and-effect relationships not apparent during real-time operations.
• Continuous Improvement: Data-driven analysis identifies opportunities for process improvement, equipment upgrades, and training needs. Quantitative evidence supports business cases for capital investments and operational changes.
The Rapidlogger system provides a complete integrated solution for data recording, presentation, and job reporting with features designed specifically for oilfield operating conditions:
Automatic, Unattended Recording: Data recording begins automatically on power-up without operator intervention. The system records continuously to the internal SD card, ensuring data is captured even if PC connection is lost or RapidVu software crashes. No user action is required to start or stop recording—eliminating the risk of forgetting to record critical job data.
Redundant Recording Architecture: Simultaneous recording to SD card and PC hard drive provides protection against single-point failures. If the SD card fills or fails, PC recording continues. If PC loses connection, SD card recording continues. Cloud backup provides off-site protection against catastrophic loss.
Proven Reliability in Harsh Environments: Ruggedized hardware with industrial-temperature-rated components, NEMA 4X environmental protection (IP67), vibration and shock resistance, and conformal-coated circuit boards ensure reliable recording despite extreme temperatures, vibration, moisture, dust, and chemical exposure typical of oilfield operations.
Long Recording Capacity: Months of continuous recording on a single SD card eliminates the need for frequent media changes. Low power consumption enables operation from truck batteries, solar panels, or small generators in remote locations.
Versatile Presentation Options: From simple front-panel LCD display for quick field checks to comprehensive multi-plot PC displays for detailed monitoring to cloud-based dashboards for remote stakeholders—the Rapidlogger system delivers the right information to the right people in the right format.
Flexible Reporting Capabilities: Automated report generation saves time and ensures consistency while remaining fully customizable to meet diverse client requirements, regulatory mandates, and internal quality standards. Same-day electronic delivery improves customer satisfaction and accelerates billing cycles.
Open Data Formats: Plain text and CSV file formats ensure data accessibility with standard tools (text editors, Excel) without requiring proprietary software. Data will remain accessible decades into the future regardless of software version availability—critical for regulatory compliance and archival requirements.
Comprehensive Support and Training: Rapidlogger provides extensive documentation, video tutorials, technical support, and on-site training to ensure operators can fully utilize recording, presentation, and reporting capabilities. Regular software updates add new features and capabilities at no additional cost.
By integrating robust data recording, flexible real-time presentation, and automated professional reporting in a single system, the Rapidlogger and RapidVu platform enables oilfield service companies to deliver superior data quality, improve operational decision-making, enhance customer satisfaction, and maintain competitive advantage in demanding markets.