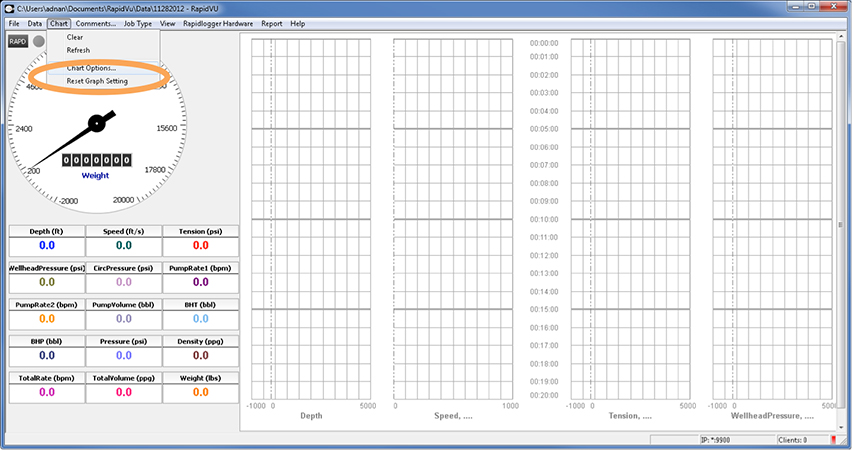
This tech note describes the process to change some basic graphical setting on the RapidVu software. In order to access the graphical settings dialog click on the “Chart” menu option and then the “Chart Options” selection. Now the chart options dialog box will appear.
Here the user can select the graph value scale. One option is the “Auto Range” option. This allows the automatic increase in the maximum and minimum values based on the value of the variables being displayed.
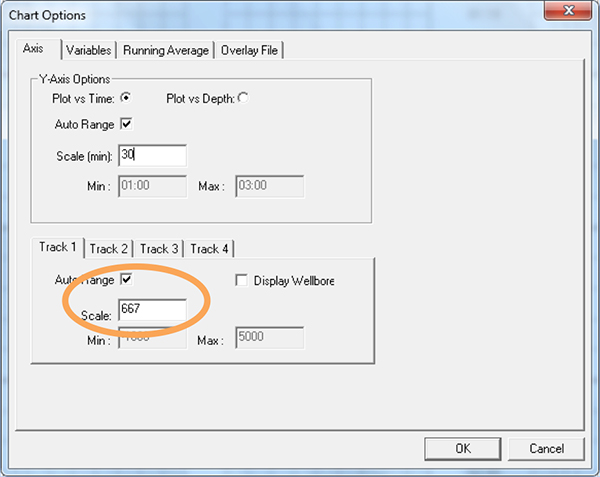
However the user can select enter the “Min and Max” values manually to prevent the graph from automatically scaling. This same selection can be made for each individual track of the graph.
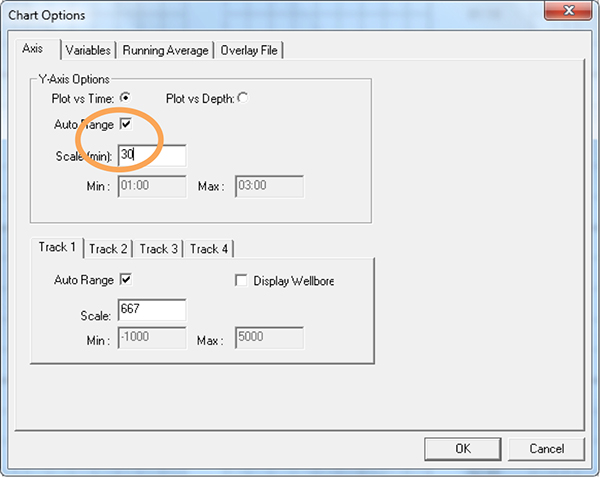
The user can also change the time scale of the graph by entering a different value in the “scale (min)” entry box. This is the size in minutes of the large time scale divisions. The time duration of the graph can thus be increased or decreased in this manner.